Shared states: using MVPA to test neural overlap between self-focused emotion imagery and other-focused emotion understanding
This chapter has been published as: Oosterwijk, S.*, Snoek, L.*, Rotteveel, M., Barrett, L. F., & Scholte, H. S. (2017). Shared states: using MVPA to test neural overlap between self-focused emotion imagery and other-focused emotion understanding. Social cognitive and affective neuroscience, 12(7), 1025-1035.
* Shared first authorship
Abstract
The present study tested whether the neural patterns that support imagining “performing an action”, “feeling a bodily sensation” or “being in a situation” are directly involved in understanding
other people’s actions, bodily sensations and situations. Subjects imagined the content of short sentences describing emotional actions, interoceptive sensations and situations (self-focused task), and processed scenes and focused on
how the target person was expressing an emotion,
what this person was feeling, and
why this person was feeling an emotion (other-focused task). Using a linear support vector machine classifier on brain-wide multi-voxel patterns, we accurately decoded each individual class in the self-focused task. When generalizing the classifier from the self-focused task to the other-focused task, we also accurately decoded whether subjects focused on the emotional actions, interoceptive sensations and situations of
others. These results show that the neural patterns that underlie self-imagined experience are involved in understanding the experience of other people. This supports the theoretical assumption that the basic components of emotion experience and understanding share resources in the brain.
Introduction
To navigate the social world successfully it is crucial to understand other people. But how do people generate meaningful representations of other people’s actions, sensations, thoughts and emotions? The dominant view assumes that representations of other people’s experiences are supported by the same neural systems as those that are involved in generating experience in the self (e.g., Gallese et al., 2004; see for an overview Singer, 2012). We tested this principle of self-other neural overlap directly, using multi-voxel pattern analysis (MVPA), across three different aspects of experience that are central to emotions: actions, sensations from the body and situational knowledge.
In recent years, evidence has accumulated that suggests a similarity between the neural patterns representing the self and others. For example, a great variety of studies have shown that observing actions and sensations in other people engages similar neural circuits as acting and feeling in the self (see for an overview Bastiaansen et al., 2009). Moreover, an extensive research program on pain has demonstrated an overlap between the experience of physical pain and the observation of pain in other people, utilizing both neuroimaging techniques (e.g., Lamm et al., 2011) and analgesic interventions (e.g., Rütgen et al., 2015; Mischkowski et al., 2016). This process of “vicarious experience” or “simulation” is viewed as an important component of empathy (Carr et al., 2003; Decety, 2011; Keysers & Gazzola, 2014). In addition, it is argued that mentalizing (e.g. understanding the mental states of other people) involves the same brain networks as those involved in self-generated thoughts (Uddin et al., 2007; Waytz & Mitchell, 2011). Specifying this idea further, a constructionist view on emotion proposes that both emotion experience and interpersonal emotion understanding are produced by the same large-scale distributed brain networks that support the processing of sensorimotor, interoceptive and situationally relevant information (Barrett & Satpute, 2013; Oosterwijk & Barrett, 2014). An implication of these views is that the representation of self- and other-focused emotional actions, interoceptive sensations and situations overlap in the brain.
Although there is experimental and theoretical support for the idea of self-other neural overlap, the present study is the first to directly test this process using MVPA across three different aspects of experience (i.e. actions, interoceptive sensations and situational knowledge). Our experimental design consisted of two different tasks aimed at generating self- and other-focused representations with a relatively large weight given to either action information, interoceptive information or situational information.
In the self-focused emotion imagery task (SF-task) subjects imagined performing or experiencing actions (e.g., pushing someone away), interoceptive sensations (e.g., increased heart rate) and situations (e.g., alone in a park at night) associated with emotion. Previous research has demonstrated that processing linguistic descriptions of (emotional) actions and feeling states can result in neural patterns of activation associated with, respectively, the representation and generation of actions and internal states (Oosterwijk et al., 2015; Pulvermüller & Fadiga, 2010). Furthermore, imagery-based inductions of emotion have been successfully used in the MRI scanner before (Oosterwijk et al., 2012; Wilson-Mendenhall et al., 2011), and are seen as robust inducers of emotional experience (Lench et al., 2011). In the other-focused emotion understanding task (OF-task), subjects viewed images of people in emotional situations and focused on actions (i.e., How does this person express his/her emotions?), interoceptive sensations (i.e., What does this person feel in his/her body) or the situation (i.e., Why does this person feel an emotion?). This task is based on previous research studying the neural basis of emotion oriented mentalizing (Spunt & Lieberman, 2012).
With MVPA, we examined to what extent the SF- and OF-task evoked similar neural patterns. MVPA allows researchers to assess whether the neural pattern associated with one set of experimental conditions can be used to distinguish between another set of experimental conditions. This relatively novel technique has been successfully applied to the field of social neuroscience in general (e.g., Gilbert et al., 2012; Brosch et al., 2013; Parkinson et al., 2014), and the field of self-other neural overlap in particular. For example, several MVPA studies recently assessed whether experiencing pain and observing pain in others involved similar neural patterns (Corradi-Dell’Acqua et al., 2016; Krishnan et al., 2016). Although there is an ongoing discussion about the specifics of shared representation in pain based on these MVPA results (see for an overview Zaki et al., 2016), many authors emphasize the importance of this technique in the scientific study of self-other neural overlap (e.g., Corradi-Dell’Acqua et al., 2016; Krishnan et al., 2016).
MVPA is an analysis technique that decodes latent categories from fMRI data in terms of multi-voxel patterns of activity (Norman et al., 2006). This technique is particularly suited for our research question for several reasons. First of all, although univariate techniques can demonstrate that tasks activate the same brain regions, only MVPA can statistically test for shared representation (Lamm & Majdandžić, 2015). We will evaluate whether multivariate brain patterns that distinguish between mental events in the SF-task can be used to distinguish, above chance level, between mental events in the OF-task. Second, MVPA analyses are particularly useful in research that is aimed at examining distributed representations (Singer, 2012). Based on our constructionist framework, we indeed hypothesize that the neural patterns that will represent self- and other focused mental events are distributed across large-scale brain networks. To capture these distributed patterns, we used MVPA in combination with data-driven univariate feature selection on whole-brain voxel patterns, instead of limiting our analysis to specific regions-of-interest (Haynes, 2015). And third, in contrast to univariate analyses that aggregate data across subjects, MVPA can be performed within-subjects and is thus able to incorporate individual variation in the representational content of multivariate brain patterns. In that aspect within-subject MVPA is sensitive to individual differences in how people imagine actions, sensations and situations, and how they understand others. In short, for our purpose to explicitly test the assumption that self and other focused processes share neural resources, MVPA is the designated method.
We tested the following two hypotheses. First, we tested whether we could classify self-imagined actions, interoceptive sensations and situations above chance level. Second, we tested whether the multivariate pattern underlying this classification could also be used to classify the how, what and why condition in the other-focused task.
Methods
Subjects
In total, we tested 22 Dutch undergraduate students from the University of Amsterdam (14 females; Mage = 21.48, s.d.age = 1.75). Of those 22 subjects, 13 subjects were tested twice in 2 sessions about 1 week apart. Half of those sessions were used for the model optimization procedure. The other half of the sessions, combined with an additional nine subjects (who were tested only once), constituted the model validation set (see Model optimization procedure section). In total, two subjects were excluded from the model validation dataset: one subject was excluded because there was not enough time to complete the experimental protocol and another subject was excluded due to excessive movement (>3 mm within data acquisition runs).
All subjects signed informed consent prior to the experiment. The experiment was approved by the University of Amsterdam’s ethical review board. Subjects received 22.50 euro per session. Standard exclusion criteria regarding MRI safety were applied and people who were on psychopharmacological medication were excluded a priori.
Experimental design
Self-focused emotion imagery task
The self-focused emotion imagery task (SF-task) was created to preferentially elicit self-focused processing of action, interoceptive or situational information associated with emotion. Subjects processed short linguistic cues that described actions (e.g., pushing someone away; making a fist), interoceptive sensations (e.g., being out of breath; an increased heart rate), or situations (e.g., alone in a park at night; being falsely accused) and were instructed to imagine performing or experiencing the content. The complete instruction is presented in the Supplementary Materials; all stimuli used in the SF-task are presented in Supplementary Table A.1. Linguistic cues were selected from a pilot study performed on an independent sample of subjects (n = 24). Details about this pilot study are available on request. The descriptions generated in this pilot study were used as qualitative input to create short sentences that described actions, sensations or situations that were associated with negative emotions, without including discrete emotion terms. The cues did not differ in number of words, nor in number of characters (F < 1).
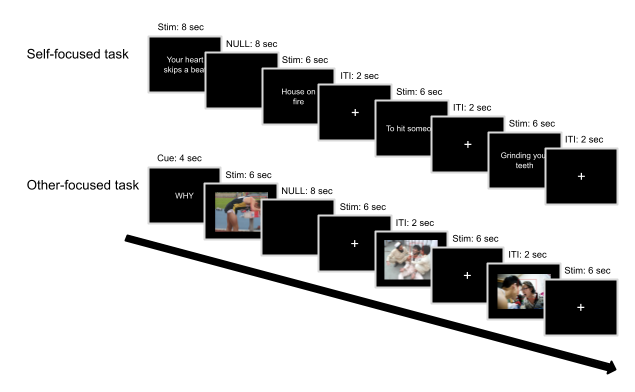
The SF-task was performed in two runs subsequent to the other-focused task using the software package Presentation (Version 16.4, www.neurobs.com). Each run presented 60 sentences on a black background (20 per condition) in a fully randomized event-related fashion, with a different randomization for each subject. Note that implementing a separate randomization for each subject prevents inflated false positive pattern correlations between trials of the same condition, which may occur in single-trial designs with short inter-stimulus intervals (Mumford et al., 2014). A fixed inter-trial–interval of 2 seconds separating trials; 12 null-trials (i.e. a black screen for 8 seconds) were mixed with the experimental trials at random positions during each run (see Figure 2.1).
Other-focused emotion understanding task
The other-focused emotion understanding task (OF-task) was created to preferentially elicit other-focused processing of action, interoceptive or situational information associated with emotion. Subjects viewed images of people in negative situations (e.g. a woman screaming at a man, a man held at gunpoint). A red rectangle highlighted the face of the person that the subjects should focus on to avoid ambiguity in images depicting more than one person. Image blocks were preceded by a cue indicating the strategy subjects should use in perceiving the emotional state of the people in the images (Spunt & Lieberman, 2012). The cue How instructed the subjects to identify actions that were informative about the person’s emotional state (i.e., How does this person express his/her emotions?). The cue What instructed subjects to identify interoceptive sensations that the person could experience (i.e., What does this person feel in his/her body). The cue Why instructed subjects to identify reasons or explanations for the person’s emotional state (i.e., Why does this person feel an emotion?). The complete instruction is presented in the Supplementary Materials.
Stimuli for the OF-task were selected from the International Affective Picture System database (IAPS; Lang, 2005; Lang et al., 1997), the image set developed by the Kveraga lab (http://www.kveragalab.org/stimuli.html; Kveraga et al., 2015) and the internet (Google images). We selected images based on a pilot study, performed on an independent sample of subjects (n = 22). Details about this pilot study are available on request.
The OF-task was presented using the software package Presentation. The task presented thirty images on a black background in blocked fashion, with each block starting with a what, why or how cue (see Figure 2.1). Each image was shown three times, once for each cue type. Images were presented in blocks of six, each lasting 6 seconds, followed by a fixed inter trial interval of 2 seconds. Null-trials were inserted at random positions within the blocks. Both the order of the blocks and the specific stimuli within and across blocks were fully randomized, with a different randomization for each subject.
Procedure
Each experimental session lasted about 2 hours. Subjects who underwent two sessions had them on different days within a time span of 1 week. On arrival, subjects gave informed consent and received thorough task instructions, including practice trials (see the Supplementary Materials for a translation of the task instructions). The actual time in the scanner was 55 minutes, and included a rough 3D scout image, shimming sequence, 3-min structural T1-weighted scan, one functional run for the OF-task and two functional runs for the SF-task. We deliberately chose to present the SF-task after the OF-task to exclude the possibility that the SF-task affected the OF-task, thereby influencing the success of the decoding procedure.
After each scanning session, subjects rated their success rate for the SF-task and OF-task (see Supplementary Figure A.1). In the second session, subjects filled out three personality questionnaires that will not be further discussed in this paper and were debriefed about the purpose of the study.
Image acquisition
Subjects were tested using a Philips Achieva 3T MRI scanner and a 32-channel SENSE headcoil. A survey scan was made for spatial planning of the subsequent scans. Following the survey scan, a 3-min structural T1-weighted scan was acquired using 3D fast field echo (TR: 82 ms, TE: 38 ms, flip angle: 8°, FOV: 240 × 188 mm, 220 slices acquired using single-shot ascending slice order and a voxel size of 1.0 × 1.0 × 1.0 mm). After the T1-weighted scan, functional T2*-weighted sequences were acquired using single shot gradient echo, echo planar imaging (TR = 2000 ms, TE = 27.63 ms, flip angle: 76.1°, FOV: 240 × 240 mm, in-plane resolution 64 × 64, 37 slices (with ascending acquisition), slice thickness 3 mm, slice gap 0.3 mm, voxel size 3 × 3 × 3 mm), covering the entire brain. For the SF-task, 301 volumes were acquired; for the OF-task 523 volumes were acquired.
Model optimization procedure
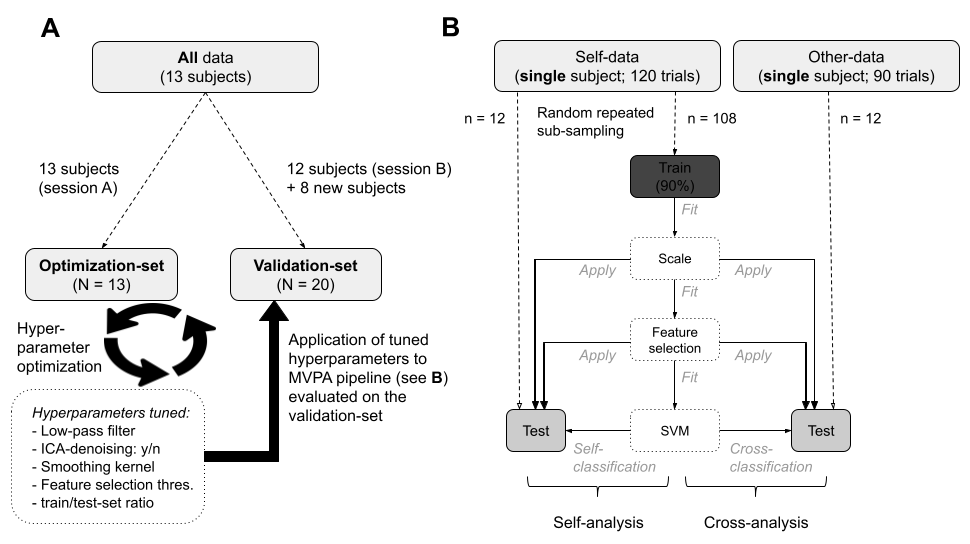
As MVPA is a fairly novel technique, no consistent, optimal MVPA pipeline has been established (Etzel et al., 2011). Therefore, we adopted a validation strategy in the present study that is advised in the pattern classification field (Kay et al., 2008; Kriegeskorte et al., 2009). This strategy entailed that we separated our data into an optimization dataset to find the most optimal parameters for preprocessing and analysis, and a validation dataset to independently verify classification success with those optimal parameters. We generated an optimization and validation dataset by running the SF-task and OF-task twice, in two identical experimental sessions for a set of thirteen subjects. The sessions were equally split between the optimization and validation set (see Figure 2.2A); first and second sessions were counterbalanced between the two sets. Based on a request received during the review process, we added nine new subjects to the validation dataset. Ultimately, the optimization-set held 13 sessions and the validation-set, after exclusion of 2 subjects (see Subjects section), held 20 sessions.
In the optimization-set, we explored how different preprocessing options and the so-called ‘hyperparameters’ in the MVPA pipeline affected the performance of the (multivariate) analyses (visualized in Figure 2.2B; see MVPA pipeline subsection for more details). Thus, we performed the self- and cross-analyses on the data of the optimization set multiple times with different preprocessing options (i.e., smoothing kernel, low-pass filter and ICA-based denoising strategies) and MVPA hyperparameter values (i.e., univariate feature selection threshold and train/test size ratio during cross-validation). We determined the optimal parameters on the basis of classification performance, which was operationalized as the mean precision value after a repeated random subsampling procedure with 1000 iterations. A list with the results from the optimization procedure can be found in Supplementary Table A.2 and Supplementary Figure A.2. The optimal parameters were then used for preprocessing and the self- and cross-analysis within the validation-set, in which the findings from the optimization-set were replicated. All findings discussed in the 2.3 section follow from the validation-set (see Supplementary Figure A.3 for an overview of the findings from the optimization-set).
Preprocessing and single-trial modeling
Functional and structural data were preprocessed and analyzed using FSL 5.0 (Jenkinson et al., 2012) and MATLAB (2012b; www.mathworks.com/products/matlab), using an in-house developed preprocessing pipeline and the parameters established in the optimization procedure. Functional data were corrected for motion (using FSL MCFLIRT) and slice timing and was spatially smoothed (5 mm isotropic kernel). After preprocessing, individual time series were modeled using a double-gamma hemodynamic response function in a single-trial GLM design using FSL’s FEAT. Resulting beta values were converted to t-values (Misaki et al., 2010), constituting a whole-brain pattern of t-values per trial. Subsequently, the data were indexed by a gray-matter mask (excluding most white-matter, CSF and brainstem voxels). Thus, the data points for the MVPA consist of whole-brain (gray matter) t-value patterns per trial. For the optimization analyses, the data were transformed to standard space (MNI152, 2 mm) using FSL’s FNIRT. To reduce computation time for the validation data, and in particular its corresponding permutation analysis, analyses on the validation dataset were performed on data in native (functional) space.
Multi-voxel pattern analysis
MVPA pipeline
Within the optimization and validation dataset, we implemented an iterated cross-validation scheme that separated the data into a train-set and a test-set (this procedure is described in more detail in the next section). Before fitting the classifier on the train-set in each iteration of the cross-validation scheme, standardization and voxel selection were estimated and applied to the train-set. Standardization ensured that each feature (i.e., voxel) had zero mean and unit variance across trials. After standardization, voxel selection was performed in each iteration on the train-set by extracting the voxels with the highest average pairwise Euclidian distance across classes, which will be subsequently referred to as a voxel’s differentiation score. More specifically, differentiation scores were calculated by subtracting the mean value across trials per class from each other (i.e., action—interoception, action—situation, interoception—situation), normalizing these values across voxels (yielding “z-scores”), and taking their absolute value. The three resulting values per voxel were averaged and the most differentiating voxels (z-score threshold: 2.3, as determined by the optimization procedure; see Model optimization procedure section) were extracted and used as features when fitting the classifier. Importantly, the standardization parameters (voxel mean and variance) and voxel indices (i.e. which voxels had differentiation scores above threshold) were estimated from the train-set only and subsequently applied to the test-set to ensure independence between the train- and test-set (see Figure 2B). After standardization and voxel selection in each iteration, a support vector classifier (SVC) was fit on the train-set and cross-validated on the test-set, generating a class probability for each trial in the test-set. Our classifier of choice was the SVC implementation from the scikit-learn svm module (Pedregosa et al., 2011) with a linear kernel, fixed regularization parameter (C) of 1.0, one-vs-one multiclass strategy, estimation of class probability output (instead of discrete class prediction) and otherwise default parameters.
Cross-validation scheme and bagging procedure
Cross-validation of the classification analysis was implemented using a repeated random subsampling cross-validation scheme (also known as Monte Carlo cross-validation), meaning that, for each iteration of the analysis, the classification pipeline (i.e., standardization, voxel selection and SVM fitting) was applied on a random subset of data points (i.e., the train-set) and cross-validated on the remaining data (i.e., the test-set). Each trial belonged to one out of three classes: action, interoception or situation. Following the results from the parameter optimization process, we selected four trials per class for testing, amounting to 12 test-trials per iteration.
Per iteration, the classifier was fit on the train-set from the SF-data. Subsequently, this classifier was cross-validated on 12 test SF-trials (test-set “self-analysis”) and 12 test OF-trials (test-set “cross-analysis”; see Figure 2B). This process was subsequently iterated 100 000 times to generate a set of class distributions for each trial. After all iterations, the final predicted class of each trial was determined by its highest summed class probability across iterations (also known as “soft voting”; see Supplementary Figure A.4). This strategy of a random sub-sampling cross-validation scheme in combination with majority (soft) voting is more commonly known as “bagging” (Breiman, 1996). An important advantage of bagging is that it reduces model overfitting by averaging over an ensemble of models, which is especially useful for multi-voxel pattern analyses because fMRI data is known to display high variance (Varoquaux, 2018).
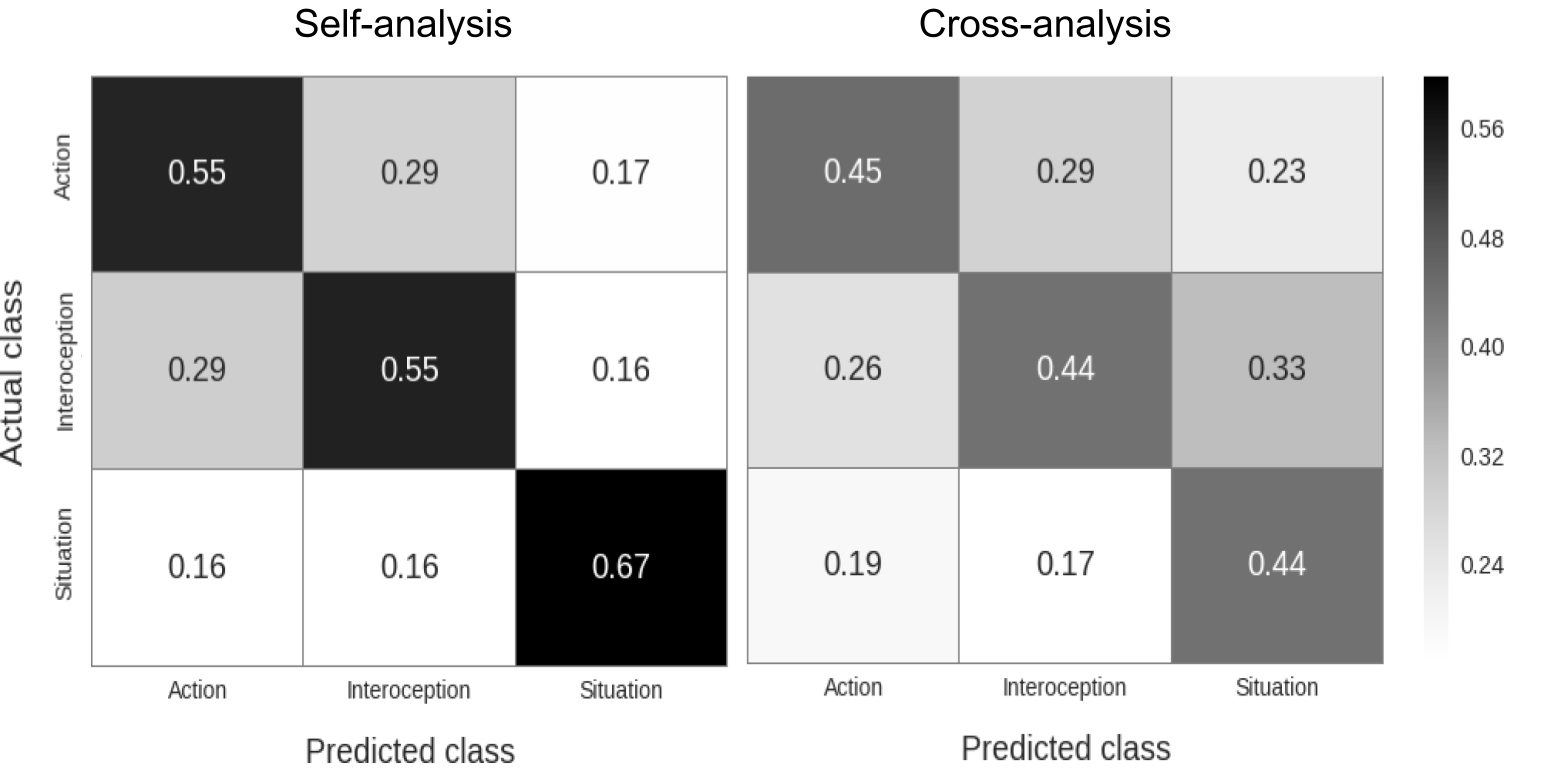
After generating a final prediction for all trials using the soft voting method, we constructed confusion matrices for both the self- and cross-analysis. In each raw confusion matrix with prediction counts per class, cells were normalized by dividing prediction counts by the sum over rows (i.e., the total amount of predictions per class), yielding precision-scores (also known as positive predictive value). In other words, this metric represents the ratio of true positives to the sum of true positives and false positives (see Supplementary Figure A.5 for a description of the results expressed as recall estimates, or the ratio of true positives to the total number of samples in that class). This classification pipeline generated subject-specific confusion matrices that were subsequently averaged to generate the final classification scores.
Statistical evaluation
To evaluate the statistical significance of the observed average precision-scores in the confusion matrices, we permuted the original self- and cross-analysis 1300 times per subject with randomly shuffled class labels, yielding 1300 confusion matrices (with precision-scores). We then averaged the confusion matrices across subjects, yielding 1300 permuted confusion matrices reflecting the null-distribution of each cell of the matrix (which is centered around chance level classification, i.e., 33%). For each cell in the diagonal of the observed confusion matrix, p-values were calculated as the proportion of instances of values in the permuted matrix which were higher than the values in the observed matrix (Nichols & Holmes, 2002). To correct for multiple comparisons, p-values were tested against a Bonferroni-corrected threshold. The distribution of precision-scores and the relationship between precision-scores in the self- and cross-analysis is reported in Supplementary Figure A.6.
Spatial representation
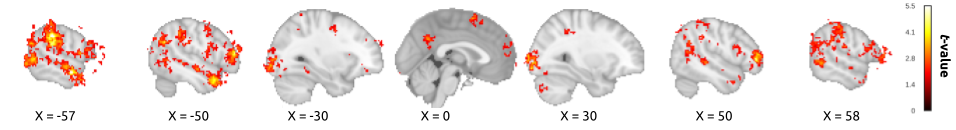
To visualize the classifier feature weights, we plotted the absolute feature weights averaged over iterations, subjects and pairwise classifiers (action vs interoception, action vs situation, interoception vs situation) that underlie our multiclass classification analysis. We chose to visualize the spatial representation of our model by plotting the average absolute feature weights, because the absolute value of feature weights in linear SVMs can be interpreted as how important the weights are in constructing the model’s decision hyperplane (Ethofer et al., 2009; Guyon et al., 2002; Stelzer et al., 2014). To correct for a positive bias in plotting absolute weights, we ran the main classification analysis again with permuted labels to extract the average absolute feature weights that one would expect by chance. Subsequently, a voxel-wise independent t-test was performed for all feature weights across subjects, using the average permuted feature weights as the null-hypothesis, yielding an interpretable t-value map (see the supplementary code notebook on our Github repository for computational details).
Additional analyses
In addition to the self-analysis and the self-to-other cross-analysis presented in the main text, we also performed a within-subjects other-to-self cross-analysis (see for a similar approach Corradi-Dell’Acqua et al., 2016) and a between-subjects self-analysis and self-to-other cross-analysis. These analyses forward largely similar results as the analyses presented in the main text. Due to space constraints, we present these additional analyses in the Supplementary Materials. Supplementary Figure A.7 represents confusion matrices with precision and recall estimates for the other-to-self cross-analysis. Supplementary Figure A.8 presents the results of MVPA analyses using condition-average voxel patterns across subjects instead of single-trial patterns within subjects.
Univariate analysis
To be complete, we also report a set of univariate analyses performed on the SF-task and the OF-task data. The univariate analyses were performed on the validation dataset, and were subject to the same preprocessing steps as the MVPA analysis, except that we did not model each trial, but each condition as a separate regressor. The group-level analysis was performed with FSL’s FLAME1 option. To examine differences in neural activity between conditions, we calculated contrasts between the three classes in the SF-task (self-action vs self-interoception; self-action vs self-situation and self-interoception vs self-situation) and the three classes in the OF-task (other-action vs other-interoception; other-action vs other-situation and other-interoception vs other-situation). We report clusters that were corrected using cluster-correction with a voxel-wise threshold of 0.005 (z = 2.7) and a cluster-wise p-value threshold of 0.05.
Code availability
The MVPA-analysis and subsequent (statistical) analyses were implemented using custom Python scripts, which depend heavily on the skbold package, a set of tools for machine learning analyses of fMRI data developed in-house (see https://github.com/lukassnoek/skbold). The original scripts were documented and are hosted at the following Github repository: https://github.com/lukassnoek/SharedStates.
Results
Multi-voxel pattern analysis
The analyses of the SF-task demonstrated that voxel patterns reflecting imagined self-focused actions, interoceptive sensations and situations associated with emotion could be decoded accurately for each individual class (all p < 0.001, see Figure 2.3). Furthermore, when we generalized the classifier based on the SF-task to the data from the OF-task (i.e. cross-analysis), we found that neural representations of emotional actions, interoceptive sensations and situations of others could also be reliably decoded above chance (all p < 0.001; see Figure 2.3). Supplementary Table A.3 presents mean precision-scores across classes for each subject separately. As predicted, our findings demonstrate that self-imagined actions, interoceptive sensations and situations are associated with distinct neural patterns. Furthermore, and as predicted, our findings demonstrate that the patterns associated with self-imagined actions, sensations and situations can be used to decode other-focused actions, interoceptive sensations and situations (see Supplementary Figure A.7 for the complementary other-to-self cross-analysis).
To visualize which neural regions were involved in the successful decoding of the three classes in the OF-task and SF-task, we display in Figure 2.4 the averaged absolute values of the SVM feature weights. Note that Figure 2.4 only displays one feature map, as both the self and cross-analysis depend on the same model. Regions displaying high and consistent feature weights across subjects were frontal pole (including parts of the dorsomedial prefrontal cortex and ventromedial prefrontal cortex), orbitofrontal cortex (OFC), inferior frontal gyrus (IFG), superior frontal gyrus (SFG), middle frontal gyrus (MFG), insular cortex, precentral gyrus, postcentral gyrus, posterior cingulate cortex/precuneus, superior parietal lobule (SPL), supramarginal gyrus (SMG), angular gyrus (AG), middle temporal gyrus (MTG), temporal pole (TP), lateral occipital cortex (lOC) and occipital pole (see Supplementary Table A.4 for an overview of all involved regions).
Univariate analyses
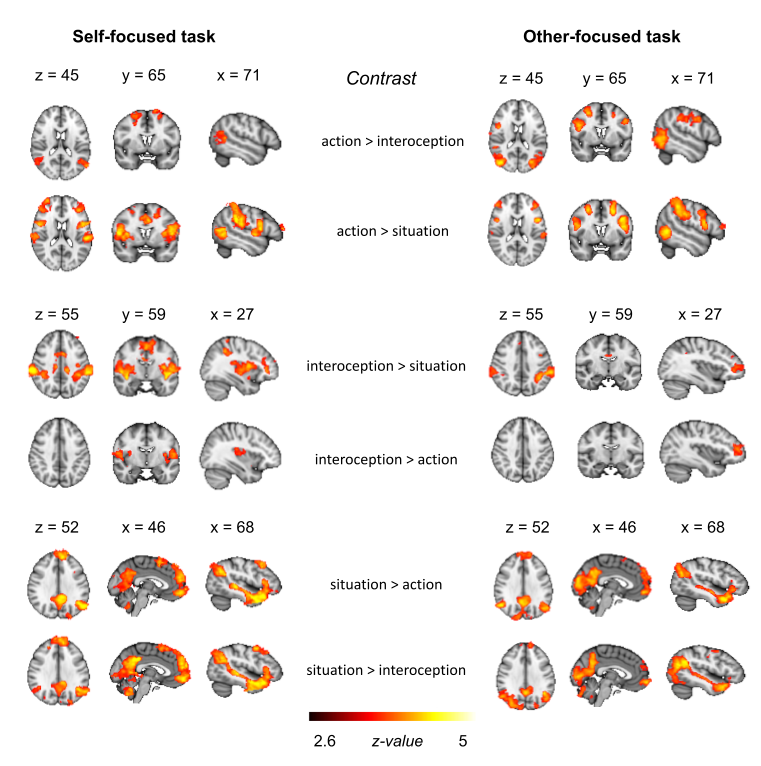
Figure 2.5 displays the pattern of neural activity revealed by univariate contrasts between the three different classes in the SF-task and the OF-task. For the sake of brevity, we summarize the most relevant univariate results here. Please see the Supplementary Materials and the study’s Github repository for an overview of all clusters.
In the SF-task, action was associated with increased involvement of the MFG, SFG, AG, SMG, lOC and middle temporal gyrus (temporo-occipital) when compared with interoception, and increased involvement of the IFG, MFG, SFG, anterior cingulate cortex (ACC), supplementary motor area (SMA), precentral gyrus, postcentral gyrus, insular cortex, SMG, SPL, lOC and middle temporal gyrus (temporo-occipital) when compared with situation. Interoception was associated with increased involvement of the insular cortex, precentral gyrus, postcentral gyrus and central operculum when compared with action, and increased involvement of the insular cortex, central operculum, parietal operculum, IFG, frontal pole, ACC, SMA, precentral gyrus, postcentral gyrus, SMG, SPL and putamen when compared with situation. The situation vs action contrast and the situation vs interoception contrast forwarded clusters in similar regions, including the temporal pole, superior/middle temporal gyrus, IFG, SFG, frontal pole, medial prefrontal cortex (mPFC), OFC, precuneus, posterior cingulate cortex (PCC), lOC, fusiform gyrus, hippocampus and lingual gyrus.
In the OF-task, action was associated with increased involvement of the IFG, MFG, SFG, precentral gyrus, postcentral gyrus, SMG, SPL, middle/inferior temporal gyrus (temporo-occipital), lOC and fusiform gyrus, when compared with interoception, and increased involvement of the IFG, MFG, SFG, frontal pole, precentral gyrus, postcentral gyrus, SMG, SPL, middle/inferior temporal gyrus (temporo-occipital) and lOC, when compared with situation. Interoception was associated with increased involvement of the left frontal pole when compared with action, and increased involvement of the SMG, SPL, precentral gyrus, postcentral gyrus, PCC, IFG and frontal pole, when compared with situation. The situation vs action contrast and the situation vs interoception contrast forwarded clusters in similar regions, including the temporal pole, superior/middle temporal gyrus, frontal pole, mPFC, PCC, precuneus, AG, lOC, occipital pole, fusiform gyrus and lingual gyrus.
Discussion
In this study, we investigated the neural overlap between self-focused emotion imagery and other-focused emotion understanding using a decoding approach. The results confirmed our hypothesis that other-focused representations of emotion-related actions, bodily sensations and situations can be decoded from neural patterns associated with accessing similar sources of information in a self-focused task. This cross-classification was successful even though the tasks employed different stimulus materials and instructions. Thus, the observed neural overlap between the underlying processes in the SF-task and OF-task cannot be attributed to similarities in stimulus dimensions or task instructions. Rather, we conclude from our findings that emotion experience and emotion understanding have basic psychological processes in common.
Although we could successfully classify the interoception class in the SF-task (across both datasets), and in the OF-task in the validation dataset, we were not able to successfully classify the interoception class in the OF-task in the optimization dataset. Furthermore, although precision and recall metrics demonstrated similar results for the action and situation cross-classification in the validation dataset, these metrics demonstrated different results for the classification of the interoception class (see Supplementary Figure A.5). This difference was partly driven by the fact that trials were very infrequently classified as interoception in the cross-classification analysis. The finding that subjects reported lower success rates for the what trials in which they were asked to identify interoceptive sensations in other people than for the how (action) and why (situation) trials may point to a possible explanation for the inconsistent findings regarding interoception. Although speculative, it may be relatively easy to recognize (and represent) interoceptive sensations when they are described in words (as in the SF-task), but relatively hard to deduce these sensations when only diffuse cues about someone’s internal state are available (e.g. posture, frowning facial expression, as in the OF-task).
An exploration of the spatial characteristics of the distributed neural pattern associated with successful decoding of the SF-task and OF-task revealed regions that are commonly active during self- and other-focused processing. First, we found that successful classification was associated with voxels in the precentral gyrus, IFG, SMA and SPL. These same regions were also revealed by the univariate analyses, in particular for the action and interoception classes. These regions are part of the so-called “mirror” network, which is argued to support both action planning and action understanding (Bastiaansen et al., 2009; Gallese et al., 2004; Spunt & Lieberman, 2012; Van Overwalle & Baetens, 2009). Furthermore, we found that successful classification was associated with voxels in the lateral occipital cortex and fusiform gyrus, which have been linked in the literature to the processing of both concrete and abstract action (Wurm & Lingnau, 2015) and the (visual) processing of emotional scenes, faces and bodies (Gelder et al., 2010; Sabatinelli et al., 2011). The univariate analyses demonstrated activity in the lOC and the fusiform gyrus in particular for the situation class, both when subjects viewed images of other people in emotional situations, and when subjects imagined being in an emotional situation themselves.
Second, we found that successful classification was associated with voxels in regions associated with somatosensory processing (postcentral gyrus) and the representation of interoceptive sensations (insular cortex, see Craig & Craig, 2009; Medford & Critchley, 2010). Univariate analyses of the SF-task also demonstrated involvement of these regions for both the action and interoception classes. This pattern of activation is consistent with embodied cognition views that propose that thinking about or imagining bodily states is grounded in simulations of somatosensory and interoceptive sensations (Barsalou, 2009). In contrast to previous work on interoceptive simulation when observing pain or disgust in other people (cf. Bastiaansen et al., 2009; Lamm et al., 2011), the univariate analyses of the OF-task did not demonstrate insular cortex activation for the interoception class.
And third, we found that successful classification was associated with voxels in the middle temporal gyrus (including the temporal pole), PCC/precuneus, dmPFC and vmPFC. These regions are part of the so-called “mentalizing” network (or “default” network). This same network was also revealed by the univariate analyses, in particular for the situation class. Meta-analyses have demonstrated that the mentalizing network is commonly active during tasks involving emotion experience and perception (Lindquist et al., 2012), mentalizing/theory of mind (Spreng et al., 2009; Van Overwalle & Baetens, 2009), judgments about the self and others (Denny et al., 2012) and semantic/conceptual processing in general (Binder et al., 2009). Moreover, this network contributes to the representation of emotion knowledge (Peelen et al., 2010) and is involved in both empathy (Keysers & Gazzola, 2014; Zaki & Ochsner, 2012) and self-generated thought (Andrews-Hanna et al., 2014). We propose that this network supports the implementation of situated knowledge and personal experience that is necessary to generate rich mental models of emotional situations, both when experienced individually, and when understood in someone else (cf. Barrett & Satpute, 2013; Oosterwijk & Barrett, 2014).
The most important contribution of our study is that it provides direct evidence for the idea of shared neural resources between self-and other focused processes. It is important, however, to specify what we think this “sharedness” entails. In research on pain, there is an ongoing discussion about whether experiencing pain and observing pain in others are distinct processes (Krishnan et al., 2016), or whether experiencing and observing pain involve a shared domain-specific representation (e.g., a discrete pain-specific brain state; Corradi-Dell’Acqua et al., 2016) and/or the sharing of domain-general processes (e.g. general negative affect; Zaki et al., 2016). Connecting to this discussion, we think that it is unlikely that our decoding success reflects the sharing of discrete experiential states between the SF-task and OF-task. After all, unlike in studies on pain, the stimuli in our tasks referred to a large variety of different actions, sensations and situations. Instead, decoding success in our study is most likely due to shared brain state configurations, reflecting the similar engagement of domain-general processes evoked by self- and other-focused instances of action (or interoceptive sensation or situation). This interpretation is consistent with views that suggests that global processes are shared between pain experience and pain observation (Lamm et al., 2011; Zaki et al., 2016) or between self- and other-focused tasks in general (e.g., Legrand & Ruby, 2009). Moreover, this interpretation is consistent with the suggestion that neural re-use is a general principle of brain functioning (e.g., Anderson, 2016).
In our constructionist view, we posit that emotion imagery and understanding share basic psychological processes (cf. Oosterwijk & Barrett, 2014). More specifically, both emotion imagery and understanding are “conceptual acts” in which the brain generates predictions based on concept knowledge (including sensorimotor and interoceptive predictions) that are meaningful within a particular situational context (Barrett, 2012; Barrett & Simmons, 2015). Based on accumulating evidence, we propose that these predictions are implemented in domain-general brain networks (cf. Oosterwijk et al., 2012; Barrett & Satpute, 2013). The relative contribution of these networks depends on the demands of the situational context. Specifically, in contexts where people are focused on actions and expressions (their own or someone else’s) a network that supports the representation of sensorimotor states (i.e., the mirror system) may contribute relatively heavily; in contexts where people are focused on bodily states (their own or someone else’s) a network that supports the representation of interoceptive states (i.e., the salience network) may contribute relatively heavily; and in contexts where people are focused on interpreting a situation (their own or someone else’s) a network that supports a general inferential meaning-making function (i.e., the mentalizing network) may contribute relatively heavily (see also Oosterwijk et al., 2015). We believe that it is likely that our ability to successfully distinguish between classes in the self-task relies on the relatively different patterns of activity across these networks for actions, interoceptive sensations and situations. Regarding our ability to successfully generalize from the self- to the other-focused task, we believe that this relies on the relatively similar pattern of activity across these networks when people generate self-focused or other-focused instances of action (or interoceptive sensation or situation).
Our explicit manipulation of the weight of action, interoceptive and situational information in the SF-task and the OF-task tests the possibility of shared representation in a novel way. Although this procedure may seem artificial, social neuroscience studies support the notion that there is contextual variety in the contribution of action, interoceptive, and situation information when understanding other people (Oosterwijk et al., 2015; Van Overwalle & Baetens, 2009). Moreover, this weighting may mimic the variability with which these sources of information contribute to different instances of subjective emotional experience in reality (Barrett, 2012). In future directions, it may be relevant to apply the current paradigm to the study of individuals in which access to these sources of information is disturbed (e.g., individuals with different types of psychopathology) or facilitated (e.g., individuals with high interoceptive sensitivity).
In short, the present study demonstrates that the neural patterns that support imagining “performing an action”, “feeling a bodily sensation” or “being in a situation” are directly involved in understanding other people’s actions, sensations and situations. This supports our prediction that self- and other-focused emotion processes share resources in the brain.