D Supplement to Chapter 5
| Contrast | Neurosynth term | Overall corr. | Cortical corr. | Subcortical corr. |
|---|---|---|---|---|
| Negative (act - pas) | Goal | 0.22 | 0.24 | 0.18 |
| Fear | 0.18 | 0.3 | -0.04 | |
| Reward | 0.17 | 0.08 | 0.43 | |
| Task | 0.17 | 0.19 | 0.17 | |
| Conflict | 0.16 | 0.2 | 0.02 | |
| Anticipation | 0.16 | 0.1 | 0.40 | |
| Monetary | 0.15 | 0.04 | 0.40 | |
| Incentive | 0.14 | 0.01 | 0.38 | |
| Demands | 0.14 | 0.17 | 0.01 | |
| Incentive delay | 0.13 | 0.02 | 0.36 | |
| Positive (act - pas) | Pain | 0.15 | 0.16 | 0.28 |
| Painful | 0.14 | 0.15 | 0.17 | |
| Execution | 0.14 | 0.14 | 0.07 | |
| Somatosensory | 0.13 | 0.14 | 0.20 | |
| Finger | 0.13 | 0.12 | 0.16 | |
| Movement | 0.13 | .13. | 0.18 | |
| Goal | 0.13 | .15. | 0.06 | |
| Hand | 0.11 | 0.11 | 0.18 | |
| Task | 0.12 | 0.12 | 0.19 | |
| Tapping | 0.11 | 0.12 | 0.13 | |
| Negative (act - pas) - Positiv (act - pas) | Reward | 0.20 | 0.09 | 0.48 |
| Task | 0.19 | 0.21 | 0.20 | |
| Monetary | 0.17 | 0.05 | 0.44 | |
| Semantic | 0.18 | 0.22 | -0.02 | |
| Anticipation | 0.17 | 0.07 | 0.43 | |
| Incentive | 0.16 | 0.02 | 0.42 | |
| Demands | 0.17 | 0.2 | 0.00 | |
| Fear | 0.15 | 0.22 | 0.05 | |
| Autobiographical | 0.16 | 0.19 | 0.02 | |
| Retrieval | 0.16 | 0.2 | -0.06 | |
| Note: The ten terms with the highest spatial correlation with the whole-brain maps (excluding anatomical terms) are reported. |
| Cluster nr. | Cluster size | Cluster max. | X | Y | Z | Region | K | Max. |
|---|---|---|---|---|---|---|---|---|
| 1 | 12024 | 6.41 | 34 | 28 | -6 | Left Frontal Pole | 997 | 4.99 |
| Right Frontal Orbital Cortex | 870 | 6.41 | ||||||
| Left Frontal Orbital Cortex | 802 | 5.49 | ||||||
| Right Frontal Pole | 743 | 5.19 | ||||||
| Right Inferior Frontal Gyrus, pars triangularis | 647 | 5.33 | ||||||
| Left Temporal Pole | 640 | 4.64 | ||||||
| Left Insular Cortex | 634 | 6.23 | ||||||
| Right Temporal Pole | 616 | 4.75 | ||||||
| Right Insular Cortex | 381 | 5.94 | ||||||
| Left Inferior Frontal Gyrus, pars opercularis | 373 | 4.53 | ||||||
| Left Frontal Operculum Cortex | 365 | 5.37 | ||||||
| Left Inferior Frontal Gyrus, pars triangularis | 324 | 5.49 | ||||||
| Right Frontal Operculum Cortex | 287 | 5.21 | ||||||
| Right Inferior Frontal Gyrus, pars opercularis | 218 | 4.48 | ||||||
| Left Middle Frontal Gyrus | 192 | 3.80 | ||||||
| Right Middle Frontal Gyrus | 102 | 3.50 | ||||||
| Right Middle Temporal Gyrus, anterior division | 39 | 3.63 | ||||||
| Left Subcallosal Cortex | 39 | 4.23 | ||||||
| Left Precentral Gyrus | 27 | 3.22 | ||||||
| Left Central Opercular Cortex | 27 | 3.12 | ||||||
| Right Thalamus | 462 | 4.76 | ||||||
| Brain-Stem, left part | 447 | 4.19 | ||||||
| Left Thalamus | 446 | 4.40 | ||||||
| Left Caudate | 257 | 4.39 | ||||||
| Right Caudate | 239 | 4.95 | ||||||
| Right Putamen | 211 | 4.53 | ||||||
| Left Putamen | 173 | 4.88 | ||||||
| Brain-Stem, right part | 153 | 4.34 | ||||||
| Left Accumbens | 61 | 4.16 | ||||||
| Right Pallidum | 34 | 3.63 | ||||||
| Right Accumbens | 29 | 4.31 | ||||||
| Right Amygdala | 26 | 3.69 | ||||||
| 2 | 7133 | 6.17 | 8 | 30 | 26 | Right Paracingulate Gyrus | 974 | 5.95 |
| Right Cingulate Gyrus, anterior division | 897 | 6.17 | ||||||
| Left Paracingulate Gyrus | 835 | 5.99 | ||||||
| Left Superior Frontal Gyrus | 832 | 4.73 | ||||||
| Left Cingulate Gyrus, anterior division | 797 | 5.89 | ||||||
| Right Superior Frontal Gyrus | 646 | 4.67 | ||||||
| Right Frontal Pole | 443 | 4.25 | ||||||
| Left Juxtapositional Lobule Cortex | 360 | 5.04 | ||||||
| Left Postcentral Gyrus | 287 | 4.15 | ||||||
| Left Precentral Gyrus | 283 | 4.08 | ||||||
| Right Juxtapositional Lobule Cortex | 281 | 4.78 | ||||||
| Left Frontal Pole | 179 | 4.11 | ||||||
| Left Middle Frontal Gyrus | 124 | 4.03 | ||||||
| Left Superior Parietal Lobule | 42 | 3.64 | ||||||
| Right Cingulate Gyrus, posterior division | 40 | 3.41 | ||||||
| Right Frontal Medial Cortex | 23 | 3.13 | ||||||
| 3 | 534 | 5.05 | -34 | -46 | -24 | Left Temporal Fusiform Cortex, posterior division | 95 | 3.98 |
| Left Temporal Occipital Fusiform Cortex | 76 | 5.05 | ||||||
| 4 | 401 | 4.13 | 20 | -50 | 0 | Right Lingual Gyrus | 182 | 4.13 |
| Right Intracalcarine Cortex | 119 | 3.77 | ||||||
| Right Supracalcarine Cortex | 38 | 3.47 | ||||||
| Right Cingulate Gyrus, posterior division | 35 | 3.78 | ||||||
| 5 | 375 | 4.70 | -16 | -50 | -2 | Left Lingual Gyrus | 115 | 4.70 |
| Left Cingulate Gyrus, posterior division | 111 | 4.05 | ||||||
| Left Precuneous Cortex | 61 | 3.97 | ||||||
| Left Intracalcarine Cortex | 43 | 3.05 | ||||||
| Note: The X, Y, and Z coordinates refer to MNI152 (2 mm) space. The regions are taken from the Harvard–Oxford (sub)cortical atlas and voxels are assigned to regions based on their maximum probability across all ROIs within the atlas. K refers to the number of voxels within a particular region. |
| Cluster nr. | Cluster size | Cluster max. | X | Y | Z | Region | K | Max. |
|---|---|---|---|---|---|---|---|---|
| 1 | 1857 | 4.40 | 0 | 6 | 48 | Right Cingulate Gyrus, anterior division | 400 | 4.10 |
| Left Juxtapositional Lobule Cortex (formerly Supplementary Motor Cortex) | 347 | 4.40 | ||||||
| Left Cingulate Gyrus, anterior division | 347 | 4.34 | ||||||
| Right Paracingulate Gyrus | 208 | 4.02 | ||||||
| Right Juxtapositional Lobule Cortex (formerly Supplementary Motor Cortex) | 164 | 4.27 | ||||||
| Left Paracingulate Gyrus | 158 | 4.27 | ||||||
| Right Cingulate Gyrus, posterior division | 67 | 3.55 | ||||||
| Left Superior Frontal Gyrus | 51 | 4.06 | ||||||
| Left Precentral Gyrus | 40 | 3.35 | ||||||
| Left Cingulate Gyrus, posterior division | 28 | 3.22 | ||||||
| 2 | 1651 | 4.54 | 50 | 36 | 2 | Right Frontal Pole | 463 | 4.54 |
| Right Inferior Frontal Gyrus, pars triangularis | 304 | 4.51 | ||||||
| Right Frontal Orbital Cortex | 240 | 3.95 | ||||||
| Right Insular Cortex | 228 | 4.21 | ||||||
| Right Temporal Pole | 143 | 3.66 | ||||||
| Right Frontal Operculum Cortex | 117 | 4.12 | ||||||
| Right Superior Temporal Gyrus, anterior division | 48 | 3.44 | ||||||
| Right Superior Temporal Gyrus, posterior division | 36 | 3.19 | ||||||
| Right Inferior Frontal Gyrus, pars opercularis | 27 | 3.02 | ||||||
| 3 | 1196 | 4.57 | -40 | 14 | -8 | Left Insular Cortex | 421 | 4.57 |
| Left Frontal Pole | 377 | 4.51 | ||||||
| Left Frontal Orbital Cortex | 128 | 3.70 | ||||||
| Left Frontal Operculum Cortex | 107 | 3.82 | ||||||
| Left Inferior Frontal Gyrus, pars triangularis | 59 | 3.67 | ||||||
| Left Putamen | 40 | 3.55 | ||||||
| 4 | 931 | 4.84 | -34 | -46 | -20 | Left Temporal Occipital Fusiform Cortex | 60 | 4.84 |
| Left Temporal Fusiform Cortex, posterior division | 44 | 4.11 | ||||||
| 5 | 570 | 3.98 | -48 | -26 | 42 | Left Postcentral Gyrus | 300 | 3.98 |
| Left Precentral Gyrus | 220 | 3.83 | ||||||
| Left Supramarginal Gyrus, anterior division | 35 | 3.27 | ||||||
| 6 | 422 | 3.95 | -26 | -26 | 64 | Left Postcentral Gyrus | 136 | 3.43 |
| Left Lateral Occipital Cortex, superior division | 117 | 3.85 | ||||||
| Left Superior Parietal Lobule | 82 | 3.65 | ||||||
| Left Precentral Gyrus | 67 | 3.95 | ||||||
| 7 | 332 | 4.11 | 26 | -68 | -4 | Right Lingual Gyrus | 149 | 3.62 |
| Right Intracalcarine Cortex | 97 | 3.33 | ||||||
| Right Supracalcarine Cortex | 39 | 3.75 | ||||||
| Right Occipital Fusiform Gyrus | 25 | 4.11 | ||||||
| 8 | 266 | 3.84 | -8 | -18 | 4 | Right Thalamus | 128 | 3.71 |
| Left Thalamus | 127 | 3.84 | ||||||
| Note: The X, Y, and Z coordinates refer to MNI152 (2 mm) space. The regions are taken from the Harvard–Oxford (sub)cortical atlas and voxels are assigned to regions based on their maximum probability across all ROIs within the atlas. K refers to the number of voxels within a particular region. |
| Image valence | IAPS database | NAPS database |
|---|---|---|
| Negative | IAPS 2683 | NAPS faces 16 |
| IAPS 2691 | NAPS faces 28 | |
| IAPS 2799 | NAPS faces 283 | |
| IAPS 3216 | NAPS faces 7 | |
| IAPS 6212 | NAPS people 127 | |
| IAPS 6313 | NAPS people 201 | |
| IAPS 6520 | NAPS people 214 | |
| IAPS 6571 | NAPS people 22 | |
| IAPS 6831 | NAPS people 226 | |
| IAPS 6840 | NAPS people 3 | |
| IAPS 9050 | NAPS people 33 | |
| IAPS 9163 | NAPS people 39 | |
| IAPS 9250 | ||
| IAPS 9400 | ||
| IAPS 9419 | ||
| IAPS 9427 | ||
| IAPS 9428 | ||
| IAPS 9429 | ||
| IAPS 9433 | ||
| IAPS 9435 | ||
| IAPS 9900 | ||
| IAPS 9921 | ||
| IAPS 9926 | ||
| Positive | IAPS 2091 | NAPS faces 107 |
| IAPS 2216 | NAPS faces 109 | |
| IAPS 2299 | NAPS faces 232 | |
| IAPS 2332 | NAPS faces 234 | |
| IAPS 2340 | NAPS faces 3 | |
| IAPS 4623 | NAPS faces 321 | |
| IAPS 7515 | NAPS faces 354 | |
| IAPS 7660 | NAPS faces 61 | |
| IAPS 8185 | NAPS faces 82 | |
| IAPS 8461 | NAPS faces 88 | |
| IAPS 8496 | NAPS faces 89 | |
| IAPS 8540 | NAPS people 168 | |
| NAPS people 174 | ||
| NAPS people 181 | ||
| NAPS people 182 | ||
| NAPS people 185 | ||
| NAPS people 186 | ||
| NAPS people 187 | ||
| NAPS people 192 | ||
| NAPS people 228 | ||
| NAPS people 43 | ||
| NAPS people 50 | ||
| NAPS people 54 | ||
| Note: Images were taken from both the IAPS (Lang, Bradley, & Cuthbert, 1997) and NAPS (Marchewka, Żurawski, Jednoróg, & Grabowska, 2014) database. |
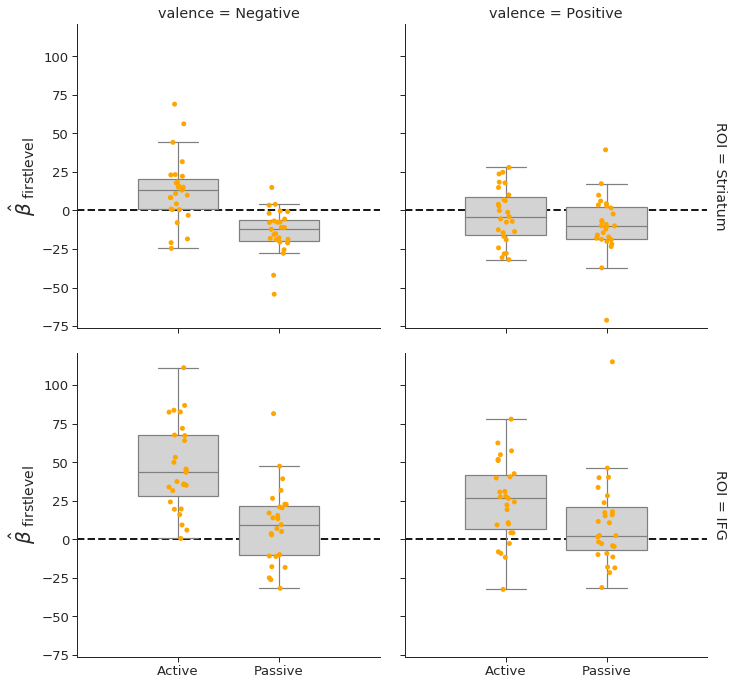
Figure D.1: Subplots of individual regressors from the significant voxels in the confirmatory contrast negative~active - passive~ - positive~active - passive~ in the induction-phase. These plots show the direction of the effects. Plots are averaged over all significant voxels within each ROI (striatum in upper plots, IFG in lower plots), separately for the negative trials (left plots) and positive trials (right plots) with subplots for the active choice and passive viewing condition. Dots represent the participant-specific ROI-average parameter estimate from the first-level analysis. The horizontal line in the boxplots represents the median and the whiskers represent the interquartile range. Note that this figure is only meant to show the directionality of the effects, not their statistical significance (as the ROIs itself only contain voxels that were significant in the group-analysis).